We turn your data into actionable marketing plans

Point it at your data.
Then just ask.

A request in plain English comes back as a finished audience, a plan for where to reach them, and a brief for the ad creative — the whole marketing plan, all at once. That's because Intelafy has already scored every person in your data on every trait, on one comparable scale.

No model to train  ·  no waiting in a data queue  ·  the measurement already happened
Intelafy · Workspace secure workspace
you
lets create an audience of sneaker buyers
intelafy
Searching the taxonomy, data dictionary, and catalog in parallel… no sneaker audience exists yet — this is a new build. Located the survey variable for athletic-shoe purchase and verified its definition.
NEW AUDIENCE · BUILT 0.0% of file
Sneaker Buyers — Active Purchasers
athletic shoes · purchased in last 12 months · total buyers
penetration 28.4%
scored on the 0–1 scaleready to segmentready to combine
Built by Craig Tomarkin & Robert Purdom · Technology partner to a national data provider
Who it's for

Data partners, agencies, and brands.

Intelafy has no data of its own — you bring the data, and its engine, the Brain, does the measuring. It works best when that data is already rich, so the best fit is teams that already pay to use large datasets about people: a market-research survey, a licensed audience dataset, or records of what people do online.

Power a data product

Data & platform partners

Companies that sell data can put the Brain inside their own product, turning their data into ready-made, sellable audiences — so their customers get finished scores instead of raw data to figure out. Intelafy already works this way with a national data provider, doing the audience scoring behind their platform.

e.g. companies that sell survey or compiled consumer data
Turn a license into campaigns

Agencies & media teams

Already pay to use a market-research survey or a record of what people do online? Point Intelafy at it and a brief written in plain English comes back as a super audience, a plan for which channels to use, and a direction for the creative — the whole marketing plan in one file.

best fit → teams that already have survey or online-behavior data
Measure your own customers

Brands, direct

Want to use your own customer data? Your own customer records go into a dedicated walled garden only you can see and are measured on the same 0–1 scale — so purchases, customer history, and wins and losses become comparable scores you own.

best for → putting your own customer data to work
Dive deeper

Go as deep as you like.

Not ready to talk yet? Start with a real session, see exactly what you get back, or read the technical case in full.

Beyond keyword search

A dictionary knows what things
are called. The Brain knows how
they actually relate.

Both an AI catalog assistant and Intelafy let you type a request and get an audience back. The AI chat part isn't the difference. The difference is what each one draws on to build the audience — the names on the data, or the measured behavior of everyone in it.

Search a catalog for “sneaker”

Zero hits. Right under a different name.

Suppose a dataset never uses the word "sneaker" and files the whole category under a label like "athletic footwear." A tool that searches for the exact word finds nothing, and a broader search for "shoe" returns so many unrelated results that the useful one is hard to pick out.

a dress-and-work-shoe row · a fashion attitude: “I only buy shoes when I have to replace something” · department-store shopping-frequency rows

missed entirely: the athletic-footwear category the buyer actually wanted — filed under a name the search never typed.
Ask the Brain for sneaker buyers

One measured audience.

The Brain understands what "sneaker buyers" means no matter what the dataset calls it, finds the underlying survey data, and scores an audience across everyone in the file. It also shows the options it considered and set aside, and why:

set aside — buyers of one brand only (too narrow for a whole-category audience)
set aside — a non-athletic shoe category (boots, dress shoes — not athletic)
set aside — an attitude, not a purchase (too indirect; saved for later personality-based targeting)
chosen — athletic shoes, purchased in last 12 months, total buyers
The label doesn't say which one makes a good audience. That's a fact about people, not about words — and only the data can answer it.
Why we built Intelafy

I spent years at Acxiom, building audience platforms the way the whole industry still does — thousands of models, one trained for every trait. I came away convinced that approach is structurally flawed, with no patch that fixes it. So I started Intelafy to do it the other way around: measure how everything relates, once, instead of training a model for every question.

The newer twist, fast becoming the industry standard, is bolting an LLM onto a data catalog. It's not AI — underneath, it's still a dictionary and a stack of trained models. Rather than fix the wrong approach, it doubles down on it.

The Intelafy Brain

Measured, not trained.
One ruler for everything.

The Brain measures how every trait relates to every other trait across everyone in the data — using fixed statistical math, not an AI model trained to hit a particular target. The same data always produces the same scores. So when you ask for an audience, the answer already exists. Building a new audience just means writing a definition and recalculating — a few days, not a months-long modeling project.

Every trait lands on the same 0-to-1 scale

one measure, applied the same way to everything

A 0.72 for “likely to buy an electric car” and a 0.72 for “likely to open an email” mean the same strength of evidence — so you can compare, rank, and combine them directly.

Your cut-off — set it by how much certainty you want 0.60
of the data qualifies (how many people)
precision of the audience

Raise the cut-off → a smaller, more precise audience. Lower it → more people. Same ruler, your choice.

The super audience

One file. The whole plan inside.

Why does this make my data more intelligent?

Raw data is a pile of disconnected fields — columns that were never meant to be read together. Intelligence is structure: the relationships between them. Intelafy turns your data into a relational space you can question — every attribute measured against every other on one scale. A super audience is that intelligence made visible: traits that were never designed to be combined, fused into a single scored audience you can act on.

So "making data intelligent" isn't a smarter model bolted on top of your data — it's your data itself, made relational, comparable, and answerable.

Most audience data answers one question: who qualifies. A super audience answers the next four — for every individual person, not just the group as a whole. Each person comes scored for how to reach them, what to offer them, why they buy, and which competitor might tempt them away. The same 0–1 scale runs across every column.

PersonAudienceEmailStreamingSocialDirect mailBest offerMotivationSwitchLeans toward

Example rows; the numbers are for illustration. Every column shown is a real, orderable score.

And you get two things: the scored file, and a ready-to-present slide deck built from the same scores — who the audience is, which channels to use, what to offer, and which competitors' customers to go after. One file does the job of the audience list, the media plan, and the creative brief at once. Because the detail goes down to each person, so does every decision.
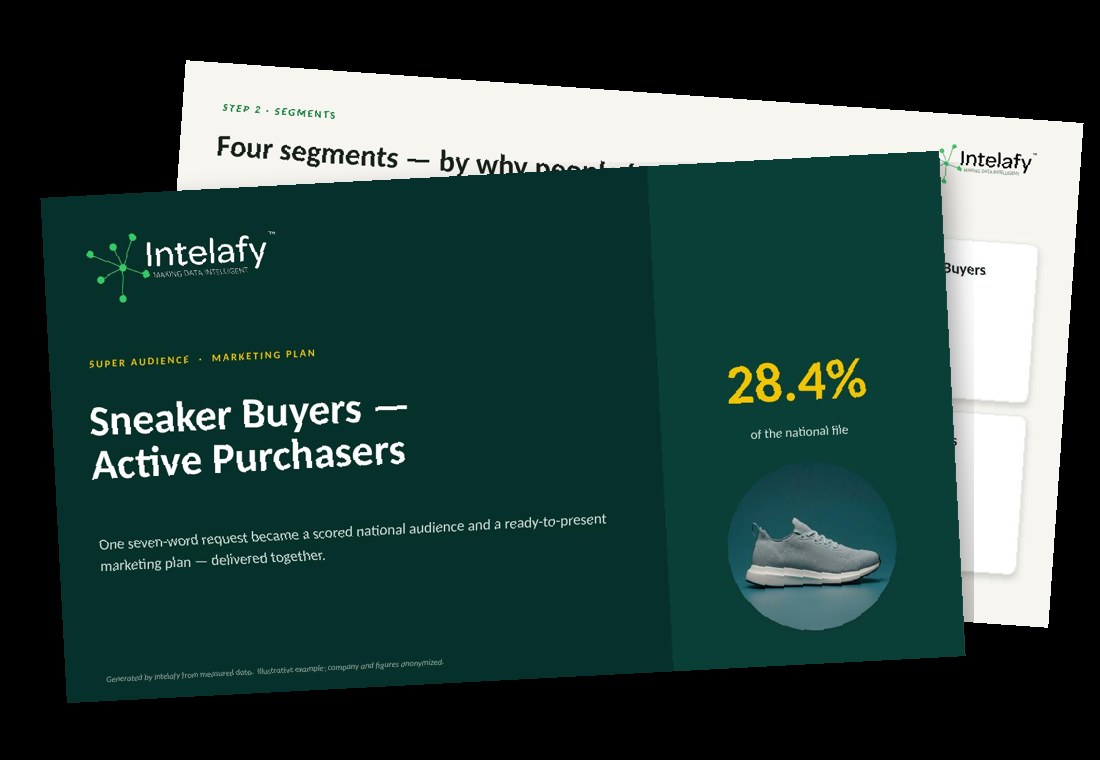
Sample super-audience marketing deck
See it for yourself

A sample super-audience deck.

The sneaker plan above, exported the way the engine returns it alongside the scored file — audience, four segments, channel and creative plans, the competitive map, and the scored-file breakdown. Illustrative; figures anonymized.

Download the sample deck (PPTX)
Built for the agency workflow

You already pay for the data.
Turn it into campaigns
just by asking.

Point Intelafy at the market-research survey data you already pay for, and your team can build audiences just by chatting with it. Here's what one full session looked like: an analyst typed a seven-word request, and a handful of messages later they had a nationwide audience, four segments within it, a plan for which channels and what creative to use for each, a five-tier map of the competition, a deep-dive on one brand prompted by a challenge from the analyst, and a creative brief for each segment.

Nothing to file and wait for. No AI model to train. No code to write. The session below is a real client session, with the company and its numbers anonymized.

1
lets create an audience of sneaker buyers

A seven-word request became a ready-to-use audience.

It searched three data sources at once, confirmed no sneaker audience existed yet, focused on how recently people bought, and returned a finished, ready-to-buy audience: Sneaker Buyers — Active Purchasers, about 28.4% of all the people in the data — a size measured from actual buying behavior, not a manual guess.
2
Lets segment this into tighter audiences based on buying motivations

Four segments by motivation — chosen, not built from scratch.

With a traditional AI setup, that's four new models to build, four times the fitting work, four timelines. Here each segment is just a definition, already scored for everyone and returned right in the reply. Each one is based on why people buy, which is what a messaging strategy actually needs.
Performance Loyalists6.5%
Training & habit
premium running-shoe purchase
Sneaker Culture & Hype Buyers3.8%
Status & self-expression
limited-release or collab purchase
Everyday Family Buyers14.2%
Durability & value
Mass-brand purchase, household with kids
Athleisure & Comfort Buyers3.5%
All-day comfort
lifestyle sneakers for non-athletic wear
3
for each of the audiences, lets identify additional targeting anchors that can inform delivery channel (email, digital, direct mail, etc...) and content

The audience became the creative brief.

For each segment, a set of specific traits to target — where to reach them, kept separate from what message will work — each trait scored on the same scale, and each segment finished with a written creative direction.
Performance Loyalists
Reach: fitness-app usage (~54%), race/event participation (~18%), sports-media consumption (~41%)
“Motion photography, technical specs up front, race-season timing.”
Hype Buyers
Reach: short-video & social apps (~71%), sneaker-resale apps (~23%), streetwear media (~20%)
“Bold collab storytelling, release-countdown urgency, drop-day timing.”
Everyday Family Buyers
Reach: mass-retail circulars (~39%), family & parenting media (~33%), back-to-school buying (~27%)
“Bright family-store scenes, practical value copy, back-to-school timing.”
Athleisure & Comfort Buyers
Reach: lifestyle & wellness content (~30%), on-feet-all-day comfort need (~25%), broad digital reach
“Soft everyday-wear imagery, errands-to-evening context, comfort-first copy.”
4
Give a competitive landscape for the sneaker industry and how does it relate to our interest groups

It understands the market, not just your data.

It described a market worth tens of billions of dollars, organized it into five tiers, matched each tier to the segments already built, and pointed out that loyalty to each brand can be measured in the data — so an audience of a competitor's customers was just one request away.
Market breakdown simplified; exact shares changed.
Mass-market conglomerates
the big global athletic brands → Everyday / Athleisure
Value & family
budget and family-oriented labels → Everyday Family
Running specialty
performance running brands → Performance Loyalists
Heritage lifestyle & streetwear
skate, court-classic, and hype labels → Hype Buyers
Premium niche brands
comfort & outdoor brands that sell straight to shoppers → Athleisure, higher-margin
5
I notice one of these brands is only in the mainstream tier — but hasn't it built a whole streetwear/hype following now too?

The analyst pushed back — and was already answered.

It didn't back down and start over. It showed where the brand already appeared in more than one tier, explained the apparent contradiction, then turned the challenge into the most useful result of the session: a brand deep-dive no one asked for, ending in a complete super-audience plan covering both segments. The details below are anonymized.

long-established, privately held brand ~3% of the streetwear tier heritage running lines drove the crossover under-35 share above the tier average back-to-school & holiday-drop seasonality
6
Lets turn each segment into a creative brief the design team can build from.

From scores to a creative brief.

One creative brief per segment, written from that segment's measured profile — a human-directed starting point for your creative team, not an automatic output. The measurement says what each segment is; your team decides how to bring it to life. The images below are illustrative creative, art-directed from each brief — not produced by the platform.
Performance Loyalists — illustrative creative
Performance Loyalists
A runner in his 30s mid-stride at dawn in performance running shoes, a GPS watch on his wrist.
Hype Buyers — illustrative creative
Hype Buyers
A young collector carefully unboxing a limited pair beside a wall-mounted sneaker shelf, phone lit with a drop alert.
Everyday Family Buyers — illustrative creative
Everyday Family Buyers
A parent and two kids in a big-box store shoe aisle, trying on sneakers together.
Athleisure & Comfort Buyers — illustrative creative
Athleisure & Comfort Buyers
Someone in comfort sneakers moving from errands into evening — the same pair, worn all day, in soft everyday light.

The analyst started with a seven-word request and finished with a creative brief for each segment — plus everything in between: the audience, the segments, the channel and creative plans, and the competitive breakdown. Other approaches break down somewhere along the way: a basic search tool can't get past the first step, and a traditional AI setup would need a separate build for each new request. What holds a session like this together is the measured data underneath it.

A flat list tells you who. A super audience tells you who, why, how, and with what words.

— because every trait is a score on the same ruler

What sets the data apart

Six properties, one design choice.

Measuring relationships directly — rather than training a separate AI model for each trait — is what gives the data all six. Together they make an audience that arrives ready to act on: comparable, explainable, stable, and complete down to the person.

0.72 = 0.72

One comparable score

Every trait lands on the same 0–1 scale, so you can compare, rank, and combine them directly. Each person is a complete, easy-to-read profile.

Why it matters
Why it matters

With a separate model per trait, one model's 0.72 and another's 0.72 mean different things — you can't compare or combine them without recalibrating first.

How it changes your plan

You define audiences as plain arithmetic on the scores — rank, threshold, and blend traits directly, with no step to reconcile scales.

What it enables

Build an audience from any mix of traits in one move, and read every person as one comparable profile.

same in → same out

Measured, not trained

Scores come from measured relationships, not an AI model trained to hit a target. Same data in, same scores out — no drifting from one request to the next.

Why it matters
Why it matters

A model fitted to a target drifts when it's retrained, so the same person's score moves — and you can't tell whether people changed or the model did.

How it changes your plan

Results stay attributable: when a number moves mid-flight, it's the campaign, not the yardstick — so you optimize on signal instead of noise.

What it enables

A stable baseline you can hold across a flight and compare across flights.

partial → full picture

Always 100% coverage

When data is missing for some people, it's filled in using the patterns across everyone — so the result always covers 100% of people, and no one is penalized for a blank. The depth of a survey (asked of a few) is extended to everyone, with thousands of traits scorable per person.

Why it matters
Why it matters

Trained scores go blank where data is thin — coverage gaps you often find only when an audience comes back too small to use.

How it changes your plan

You size and activate against the whole population, not just the well-covered slice — no silent shrinkage between definition and delivery.

What it enables

Extend a survey asked of a few to everyone, with thousands of traits scorable per person.

excluded at source

Built for a regulated world

No personal identifying information is needed, and when protected data is left out, it's truly absent from the scoring — something you can prove, not just promise. Transformations are designed to be compliant with fair-lending rules (FCRA / Reg-B) and can be tailored to each company's definitions. Every score keeps a record of what evidence produced it. Compliance depends on your data, use, and counsel.

Why it matters
Why it matters

Dropping protected fields before training doesn't remove them — proxy variables reconstruct them inside the model. Excluding them before scoring makes their absence structural.

How it changes your plan

You can show, not just assert, what did and didn't inform a score — the audit trail is the score's own record of evidence.

What it enables

Audiences built for regulated use. Whether any specific use is compliant depends on your data, your use, and your counsel.

locked for the campaign

Scores that hold still

The same person keeps the same score for the entire length of a campaign. When results change, it's because the campaign changed — not the way things are measured.

Why it matters
Why it matters

When the yardstick moves between requests, you can't separate a real change in people from a change in the model.

How it changes your plan

Mid-campaign lifts and drops read as campaign effects, not measurement wobble — so your tests actually conclude.

What it enables

Clean before/after reads and honest experimentation on a fixed baseline.

ranked by evidence

Recommendations built in

Start from any trait and get everything else ranked by how strongly it relates — each match explained by the evidence behind it. True substitutes tend to surface as substitutes. Which brands read as rivals depends on your file.

Why it matters
Why it matters

The ranking is built in — no separate similarity model to train, and every match carries the evidence behind it.

How it changes your plan

Expansion and look-alikes arrive with a reason for every match, so you can defend who's in and who's out.

What it enables

Competitor read-across from any starting point. Which brands read as substitutes depends on what's in your file.

Ways to work with us

Intelafy brings the Brain.
You bring the data.

Intelafy has no data of its own — it's the engine. Point it at data you license, your own customer data, or both. Each setup is its own walled garden that only you can see, under the same privacy exclusions and access controls.

Build the list

Super audience

We build the audience and score every person in it — who's in, which channel, what offer, their motivation, and which competitor they lean toward — plus a ready-to-present slide deck. Delivered within five business days.

best for → net-new campaign audiences
Enrich your list

Data append

You supply the records — your customer list, prospects, any set. They come back with scores added for whatever traits you need — as few as one, or a full profile.

best for → adding scores to a list you already have
Your world, measured

Dedicated build

Your own private version of the Brain, measured across everything licensed data brings plus everything you add — purchases, customer history, wins and losses. Your scores genuinely change, and stay on the same comparable scale.

best for → putting your own customer data to work
Find more like them

Look-alike extension

Give us a starting group — customers, survey respondents, any segment — and we score everyone else for how similar they are, with a reason for each match. The starting group's own defining data is left out, so matches are found on independent evidence.

best for → finding new customers nationwide

Start with a Data Discovery.

Tell us what data you license and what campaigns you run. We'll show you the audiences you could build, the scores you could add, and the questions your team could be asking — all from your own private version of the Brain.

Founded by Craig Tomarkin & Robert Purdom Technology partner to a national data provider